
Blogs /
Marketing Strategy
As travel demand evolves, hotel marketing is no longer just about visibility—it’s about being discovered where booking decisions are made. This report explores how search, social, and AI are reshaping guest acquisition.
By Shahar Rubin, Co-founder

I’d start with one guest segment, one booking goal, and 12 months of hotel results - not a new AI tool. Then I’d use AI to compare hotels your guests would actually choose, check pricing and review patterns, and test one change that could earn more profit from direct bookings.
Here’s the approach I’d follow:
Choose the right data and tools: Check coverage, sources, update times, costs, and connections to your hotel systems. Keep public rates separate from booked results and forecasts.
Find an offer you can deliver: Match pricing, packages, and messaging to guest needs - and fix service problems before promoting them.
Test before automating: Check data, privacy rules, and AI outputs for two to four weeks before allowing automated rate or budget changes.
Measure profit, not just reservations: Track occupancy, ADR, RevPAR, cancellations, and direct bookings. Subtract campaign fees and service costs, then keep, revise, or stop the test.
My rule: <u>AI recommends; your team decides.</u> More bookings matter only when they bring more profit without hurting the guest experience.
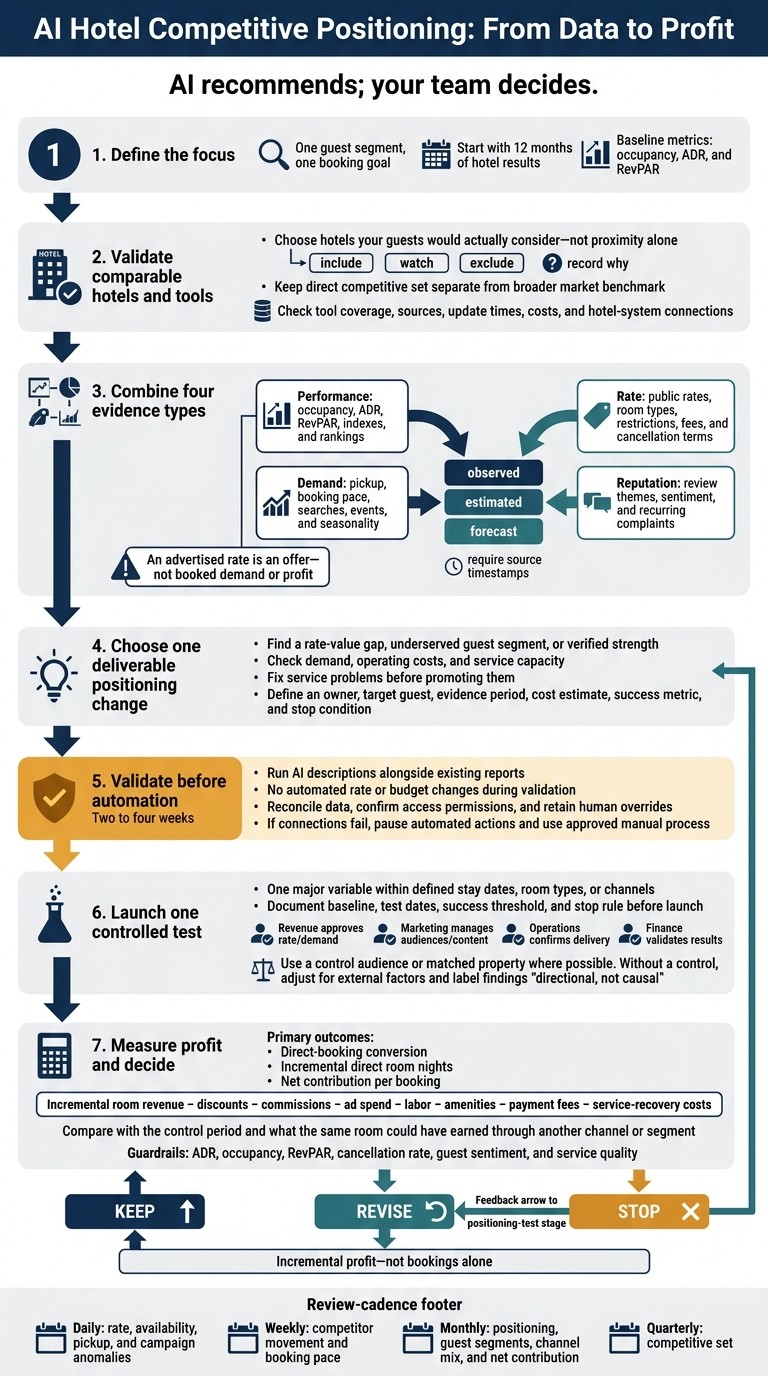
AI Hotel Competitive Positioning: From Data to Profit
Analyze Competitors Fast with AI (just 10 minutes!)
2. Choose Comparable Hotels and Evaluate AI Tools
Keep your competitive set separate from the broader market so you can tell property-level changes from market shifts. Use the baselines from Section 1 to check whether each candidate hotel competes with yours.
Group | Scope | Selection basis | Business use | Limitation |
|---|---|---|---|---|
Direct comparable hotels | Properties competing for largely the same guests and dates | Location, access, product, service level, rates, amenities, demand sources, and booking behavior | Position rates, packages, rooms, channels, and messaging | Small or poorly chosen sets can mislead |
Broader market benchmark | Hotels across a defined city, submarket, destination, or segment | Geographic or statistical market boundaries | Identify market growth, seasonality, and demand shifts | May include dissimilar products, guests, and costs |
Check AI-Selected Comparable Hotels
Treat each recommendation as a hypothesis, not a final choice. Label each property include, watch, or exclude, and record why. Check those choices against sales feedback, lost-business reports, booking searches, and reservations data - not proximity alone. Track membership changes so a revised set doesn’t look like improved performance.
Selection criterion | Data inputs | AI assessment | Human review requirements |
|---|---|---|---|
Location and submarket | Address, neighborhood, transit access, attractions, airports, convention centers | Estimates geographic and functional proximity | Confirm whether guests see the properties as interchangeable |
Property size and room inventory | Room count, room types, sellable inventory, out-of-order rooms | Estimates scale and possible supply competition | Check whether inventory and room mix are comparable |
Service level and category | Brand tier, staffing model, front desk and concierge services | Classifies product positioning | Confirm whether the guest experience is comparable |
Rates and restrictions | Public rates by date, room type, booking window, and restrictions | Detects price proximity and rate bands | Separate promotions, member rates, packages, and sold-out dates; compare like room types only. |
Amenities and facilities | Breakfast, parking, pool, pet policy, workspace, meeting facilities | Identifies features that add value | Determine which amenities influence bookings in the local market |
Guest segments | Business, leisure, groups, families, extended stay, government, crew | Infers audience overlap from content, reviews, and booking patterns | Validate with PMS, CRM, sales, and market-segment data |
Demand generators | Conventions, sports, hospitals, universities, airports, attractions, offices, seasonal events | Links hotels to shared demand sources | Confirm whether the same events produce comparable demand |
Booking behavior | Open/closed rooms, restrictions, booking pace, lost business, search impressions | Detects possible date-specific competitors | Verify coverage, timestamps, and whether availability reflects sellout or inventory controls |
Use tool outputs to guide rate, package, and messaging decisions only after these checks.
Distinguish Performance, Rate, Demand, and Reputation Data
An advertised rate is an offer - not booked demand or profit. Compare current-month, quarter, year-to-date, and rolling 12-month trends. Check year-over-year changes against seasonality, events, and submarkets. Read rankings alongside indexes: rank shows order; an index shows relative performance. Timestamp change alerts before acting.
Intelligence category | Business question | Required data | Interpretation limit |
|---|---|---|---|
Performance | Where does the hotel lead or trail its competitive set? | Occupancy, ADR, RevPAR, index values, rankings, historical and year-over-year results | Does not explain profitability, guest mix, or performance causes |
Rate | What are competitors charging, and under which conditions? | Daily public rates, room types, restrictions, taxes, fees, cancellation terms, and stay dates | Public offers do not reveal booked rates, occupancy, net revenue, or profit |
Demand | When and why is demand changing? | Pickup, search activity, booking pace, events, holidays, seasonality, submarket data, and demand-generator calendars | Modeled demand or searches may not become reservations |
Reputation | What do guests value or criticize? | Review scores, review themes, response patterns, sentiment, and amenity mentions | Review volume and demographics vary across properties and platforms |
STR/CoStar STAR benchmarks hotel-submitted performance data. HotStats benchmarks revenue, cost, and profit. Both are data sources, not AI tools.
Once you’ve fixed the set, assess each tool by how well it tracks those properties.
Compare Tool Features, Coverage, and Limits
Ask providers to demonstrate outputs using your documented set. Check whether each tool uses observed data or modeled estimates, which properties and channels it covers, how often it updates, and how much history it retains. Confirm whether it connects with your hotel’s PMS, CRS, RMS, CRM, and online booking engine.
Keep observed, estimated, and forecast values separate, and require source timestamps. Verify update frequency and feature availability directly with the provider.
Data source | Competitive question answered | AI output | Update frequency | Usage limitation |
|---|---|---|---|---|
Rate-shopping and OTA data | What are competitors selling, and under what conditions? | Rate comparisons, alerts, parity findings, and pattern summaries | Often daily or more frequently; confirm with the provider | Public offers only, not occupancy, booked rates, or profit |
PMS, CRS, and booking-engine data | Which segments, dates, and channels produce bookings? | Pace forecasts, segment patterns, cancellation risks, and anomaly alerts | Near real time to daily, depending on integration | Requires clean data, permissions, and reliable connections |
Benchmarking data | How does the hotel perform against its market or competitive set? | Trend summaries, indexes, variance explanations, and forecasts | Daily, weekly, or monthly, depending on provider and report | Interpretation depends on reporting lags, sample rules, and set definitions |
Demand and event data | What may drive future demand? | Event impact estimates, demand forecasts, and date recommendations | Daily or event-driven | Estimates may fail when events change or behave unusually |
Reputation and review data | What guest needs or complaints create positioning opportunities? | Sentiment, themes, competitor comparisons, and issue prioritization | Daily or weekly, depending on source | Uneven coverage and misread context can distort findings |
Financial and P&L data | Does a positioning action improve profit? | Margin analysis, cost alerts, and profit forecasts | Monthly or based on accounting close | Results depend on accounting consistency and close timing |
3. Turn AI Findings Into Positioning Decisions
Use the competitive set, rate data, and review themes from the previous section to decide what to change, what to promote, and what to fix.
Find Rate-Value Gaps and Underserved Guests
Use AI to spot rate-value gaps across room types, booking windows, days of the week, demand periods, amenities, cancellation terms, and guest segments. Look for dates when your hotel offers equal or better value at the same or a higher rate - or when a small price premium offers guests little in return.
Check each opportunity against demand, operating costs, service capacity, and your ability to deliver what you promise. Value-based pricing should reflect what a guest segment will pay for, not just what competitors charge.
Test a package for a specific segment within set stay dates and service limits before offering it more broadly. When you find a pricing or package gap, check that guest feedback supports the positioning you plan to use.
Check Your Positioning Against Guest Reviews
Use current reviews to check whether guests’ experiences support your rate and package messaging. Compare similar periods and sample sizes across comparable hotels.
Promote a strength only if guests mention it repeatedly, it still holds true, it sets your hotel apart, and your team delivers it consistently. Fix recurring cleanliness or service complaints before promoting premium service. Treat small review samples as clues, not proof.
Move only patterns that recur and hold up under review into testing.
Link Positioning Actions to Results
Give each proposed change an owner, target guest, evidence period, cost estimate, success metric, and stop condition. Start with a limited test by stay date, room type, or channel. Use this scorecard to connect each finding to a booking or profit outcome.
AI-detected signal | Positioning response | Supporting metric | Review cadence |
|---|---|---|---|
Rate-value gap versus comparable hotels | Add or remove inclusions, adjust room-category value, or reposition the rate without a broad discount | ADR, RevPAR, package contribution profit, conversion | Weekly during testing |
Underserved weekday business segment | Test a weekday work package with quiet workspace, Wi-Fi, coffee, or late checkout | Weekday occupancy, business-segment bookings, ADR, net revenue per booking | Weekly |
Amenity or service difference | Promote a verified strength or fund a service improvement | Amenity mentions, review sentiment, conversion, complaint rate | Monthly |
Negative sentiment around cleanliness, service, or value | Fix the underlying issue before increasing promotional spend | Negative mentions, rating, repeat complaints, refunds, labor cost | Weekly until stabilized |
Demand-period imbalance | Use fenced offers or targeted packages for shoulder periods instead of property-wide discounts | Occupancy by day, ADR, RevPAR, cancellation rate | Weekly |
Weak direct-booking visibility | Improve website messaging, metasearch presence, audience targeting, and rate presentation | Direct-booking share, website conversion, cost per booking, commission savings | Weekly or daily during campaigns |
Before launching, define the financial equation: incremental room revenue minus discounts, commissions, ad spend, labor, amenities, payment fees, and service-recovery costs.
Compare that result with the control period and what the same room could have earned through another channel or segment. Judge the test by net contribution - not bookings alone - while tracking guest sentiment and service quality.
4. Put the Workflow Into Practice and Measure Results
Once you choose a positioning test, set the data rules before changing rates or campaigns.
Audit Data, Connections, and Measurement Rules
Use 90 to 365 days of history and the same occupancy, ADR, and RevPAR definitions from Section 1. Before analysis, reconcile PMS, CRS, booking-engine, channel, reputation, website, and campaign data.
Build a data inventory that covers dates, room types, rate plans, bookings, cancellations, no-shows, stay dates, booking dates, revenue, channel, and competitor IDs. Use U.S. dollars, U.S. date formats, and consistent property and market identifiers. Treat missing values as data-quality issues first - not demand signals. That keeps the test focused on positioning rather than data noise.
Use the following controls to keep the test valid.
Prerequisite or risk | Control | Responsible role |
|---|---|---|
Incomplete data, connection failure, or API change | Reconcile daily totals against the PMS, flag missing fields, monitor connections, and maintain a manual export process | Systems owner and revenue manager |
Inconsistent room, rate, or competitor IDs | Maintain a shared data dictionary and approved mapping table | Revenue manager |
Privacy or guest-data access without permission | Use role-based access, pseudonymization, least-privilege permissions, and vendor agreements | Privacy or legal owner |
Bad recommendation or major demand shocks | Annotate events, weather, closures, and material competitor changes; allow overrides and record the trigger, approver, and review date | General manager and revenue manager |
Unclear attribution, double counting, or missing ownership | Define channel credit, cancellation treatment, lookback windows, and incremental-test rules; assign an owner to each metric, alert, and decision | Marketing, finance, and general manager |
Use aggregated demand, room, and rate data, along with pseudonymized booking IDs. Follow applicable U.S. privacy and security requirements.
During validation, run AI descriptions alongside existing reports for two to four weeks without automated rate or budget changes. If connections fail, pause automated actions and switch to the approved manual process.
Run Managed Campaigns With Sail
After the data checks pass, test the positioning hypothesis through campaign execution. Sail can run managed campaigns on Facebook, Instagram, Google, and metasearch. Check its current terms, integrations, billing basis, and attribution before including it in the test budget.
Test Changes and Schedule Reviews
With clean data and clear ownership, launch one controlled test. The revenue manager should approve rate and demand decisions. Marketing should manage audiences and ad content, while operations confirms delivery. Finance should validate results, and the general manager should approve major overrides and resolve conflicts.
Document the baseline, test dates, success threshold, and stop rule before changing one major variable. Use a control audience or matched property where possible. Without a control, adjust comparisons for weekday mix, seasonality, events, weather, renovations, inventory restrictions, and changes in cancellation behavior. Label those findings directional, not causal.
After validation and launch, keep a regular review schedule:
Daily: Check rate, availability, pickup, and campaign anomalies.
Weekly: Review competitor movement and booking pace.
Monthly: Review positioning, guest segments, channel mix, and net contribution.
Quarterly: Review the competitive set.
Report revenue and costs in U.S. dollars. Separate booked from stayed revenue, and attributed from incremental bookings. Each monthly report should include occupancy, ADR, RevPAR, room revenue, direct and OTA bookings, cancellations, no-shows, booking pace, channel costs, competitor rates and availability, review themes, campaign spend or provider fees, and explanations for material changes.
5. Conclusion: Start With One Measurable Positioning Test
Choose one goal, one segment, one test period, one review date, and one change. Measure results against your occupancy, ADR, and RevPAR baselines. Compare your property only with hotels your guests would actually choose. Base your decision on rate, demand, performance, and review data - not rate shopping alone.
Turn that evidence into a clear value proposition your team can deliver. AI spots the opportunity; managers decide whether it fits the property. Before launch, get approval from revenue, marketing, and operations on the claim, offer, and execution.
Track direct-booking conversion, incremental direct room nights, and net contribution per booking. Use ADR, occupancy, RevPAR, and cancellation rate as guardrails. Subtract acquisition and variable servicing costs before judging the result. Keep, revise, or stop the change based on incremental profit from direct demand - not report volume.
FAQs
Can a small hotel use AI with limited booking data?
Yes - a small hotel can use AI in a pay-per-stay model without much historical booking data. Sail funds and runs the campaigns, and you pay only when a new guest completes their stay.
Its AI tracks performance and shifts spending toward ads that bring in revenue from completed stays. Sail also connects to your booking engine and ad accounts to fine-tune campaigns as results come in.
How can I separate AI-driven gains from seasonal demand?
Compare actual occupancy and revenue with your AI’s initial forecasts. Use past booking patterns and real-time market data to separate seasonal changes from spikes linked to local events or other outside factors. Track return on ad spend and direct booking volume over time.
Sail tracks campaign performance continuously and shifts spending toward sources that bring in revenue from completed stays. This helps you measure growth against your goals.
What should I do when AI recommendations conflict with guest feedback?
Treat AI as a tool you work with, not the final authority. It can analyze large datasets, predict behavior, and automate decisions. But your expertise and guest feedback add context AI may miss.
Use that context to shape marketing and guest engagement plans around your property’s goals and market conditions. Pairing data-driven insights with guest feedback helps you compete with a clear plan and a personal touch.
Related Blog Posts
Share:
20 years of hospitality lessons. No fluff. No spam
Join 500+ hospitality pros getting our best growth playbooks.

hi@sailtech.ai
RESOURCES
Products
Free Tools
© 2026 Sail. All rights reserved.