Blog /
Marketing Strategy
Geo signals—origins, access, events, neighborhood demand, and campaign tests—forecast and validate hotel bookings
By Shahar Rubin, Co-founder

Geo data helps me forecast hotel demand - not guaranteed bookings. I start with 3–5 guest source markets, compare their signals with actual reservations, and check 30-, 60-, and 90-day forecasts before changing rates or ad spend.
I focus on five questions:
Guest origins: Where do guests live, and how far ahead do they book?
Travel access: Do flights, roads, and transit support trips on their planned dates?
Events and attractions: Which visits may lead to overnight stays rather than daytime traffic?
Hotel and neighborhood demand: Is booking pace changing at my hotel, nearby hotels, or across the area?
Geo-targeted campaigns: Do ads produce profitable stays compared with markets where I don’t run them?
My rule: <u>more searches or visits don’t automatically mean more room nights.</u> I use aggregated data, keep geographic boundaries fixed, and check results against completed stays, cancellations, and revenue. That gives you a way to test where demand may grow before spending more.
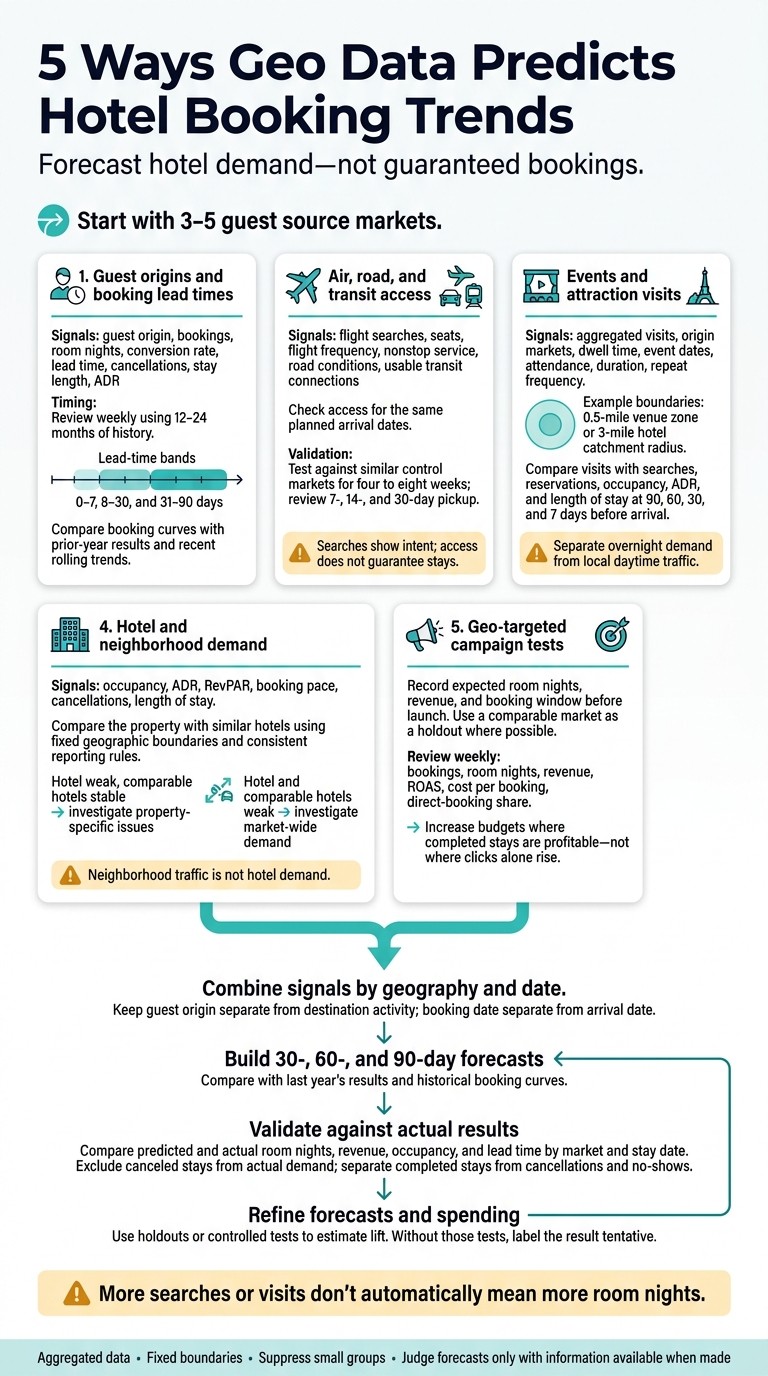
5 Ways Geo Data Predicts Hotel Booking Trends
Demand Forecasting and Booking Analytics
Link Geographic Signals to Booking Data
Before forecasting demand, bring your geographic signals into one reporting table using data from your PMS, CRS, booking engine, and website analytics. Include booking date, arrival date, departure date, room nights, room revenue, cancellations, channel, guest origin, website sessions, and completed bookings.
Join first-party records to licensed, aggregated travel or location data by geography and date - not mobile device IDs. Check that contracts permit forecasting and marketing use and require aggregation or anonymization. Suppress very small geographic segments.
Keep guest origin separate from destination activity. A guest’s home metro is a source market. Activity near your property is a destination signal. Website data shows where a session started, which isn’t necessarily where the traveler lives. Label visits, bookings, and stayed room nights separately so local foot traffic doesn’t get counted as an overnight stay.
Track booking date and arrival date separately. Booking date shows when demand builds; arrival date shows when rooms will be used. Calculate lead time as arrival date minus booking date. Keep cancellation dates, and exclude canceled stays from actual demand. Standardize time zones and report room revenue separately from taxes and fees.
Use the same ZIP code groups, metro boundaries, or fixed-mile radius across reporting periods. Document whether you measure distance in driving miles or straight-line miles.
Match reporting periods to your actual booking window. Use short windows, such as the next 7–30 days, for pricing, promotions, and staffing. Use longer windows, such as 3–12 months, for budgeting and event planning. Compare each geographic signal within the same booking window, and segment results by lead-time band.
For example, use 0–7, 8–30, and 31–90 days.
1. Track Guest Origins and Booking Lead Times
Geographic Signals and Required Data
Review origin markets weekly using 12–24 months of history. For each market, track bookings, room nights, conversion rate, lead time, cancellations, stay length, and ADR. Calculate ADR by dividing lodging revenue by occupied room nights. Use the same definition for each origin market across all channels.
Booking Forecasts
Plot each market’s cumulative room nights by days before arrival. Compare these booking curves with prior-year results and recent rolling trends. Then estimate remaining bookings using each market’s stay lengths and cancellation patterns.
Add aggregated indicators - origin volume, arrival seasonality, stay duration, and destination overlap - to check whether travel intent is growing faster than bookings. More destination visits without more hotel bookings calls for a pricing and distribution review, not an automatic forecast increase.
Marketing Actions
Start awareness campaigns before each market’s usual booking window. As that window approaches, shift to messages focused on booking.
For drive markets, highlight parking and weekend convenience. For fly-in guests, focus on airport access. Use destination overlap to shape itinerary messaging, and hold longer-stay inventory only when room nights, ADR, and net demand support it.
Booking Validation
Check forecasts against stayed room nights, stay length, ADR, and revenue by origin and arrival month. Review the next 30 days weekly and longer windows monthly.
If cancellations repeatedly cause a market to fall short, lower its expected stay-through rate. If late bookings consistently beat forecasts, adjust campaign timing and keep suitable rooms available. When one origin market shifts sharply, check for changes in access before revising the forecast.
2. Track Air, Road, and Transit Access
Access data helps predict bookings by showing which markets can turn travel plans into stays.
Match Air Signals to Arrival Dates
Once you’ve identified source markets, check whether travelers can reach you on their planned arrival dates.
Match route-level flight searches with seats, flight frequency, and nonstop service for those same dates. Separate domestic and international markets because booking lead times differ. Airport passenger growth can overstate local lodging demand if most passengers are only connecting.
Track the gap between flight searches, hotel searches, and reservations for each source market. When access improves, use that gap to time your ads: awareness early, conversion later.
Searches show intent. Access data helps show whether travelers can follow through.
Separate Growth From Travel Friction
Check highway traffic, drive times, closures, and weather alongside airport disruptions, delays, and cancellations. For transit, verify frequency, operating hours, station access, and connections. A nearby station doesn’t guarantee a useful trip. Disruptions can shift bookings toward hotels that are easier to reach without increasing total destination demand.
Signal | Likely booking effect | Marketing response |
|---|---|---|
New nonstop service or more scheduled seats | Possible source-market growth; confirm with hotel searches and pickup. | Test access-focused ads in affected markets. |
Airport disruptions, delays, or flight cancellations | Short-lived, same-day demand near the airport. | Check live arrivals and room availability before advertising. |
Highway closure, severe congestion, or major construction | Delayed arrivals or weaker short-lead demand from affected cities. | Target only markets where travelers can reasonably reach you. |
Improved transit service or a transit shutdown | More car-free bookings - or fewer during outages. | Update access messaging for affected dates. |
Validate Before Raising Spend
Test booking pickup from route changes or disruptions against similar control markets for four to eight weeks. Review 7-, 14-, and 30-day pickup. Increase spend only when affected markets show booking lift. Check cancellations and actual arrivals before treating that lift as lasting growth.
3. Track Event and Attraction Visits
Access data shows who can travel. Event data shows when demand may spike.
Use Fixed Venue Boundaries
Map convention centers, stadiums, concert venues, and major attractions, then set a fixed radius around each. Keep those boundaries unchanged across reporting periods. Track aggregated visits, origin markets, and dwell time - not individual movement histories.
Use a 0.5-mile venue zone or a 3-mile hotel catchment radius.
Connect Visits With Booking Pace
With the catchment fixed, compare visits with hotel booking optimization pace. Line up visit data with searches, reservations, occupancy, ADR, and length of stay at 90, 60, 30, and 7 days before arrival.
More visits from outside markets, longer dwell times, and more hotel searches are better signals of lodging demand than brief local foot traffic. Still, treat visits as modeled counts - not a complete visitor census. Use aggregated, anonymized data, suppress small groups, and target broad origin markets without inferring individual visits to sensitive sites.
Separate Event Demand From Normal Traffic
Add event dates, attendance, duration, and repeat frequency to your dashboard to put those patterns in context. Compare event days with prior-year event days and nearby non-event dates. Use past booking pickup to schedule campaigns before demand peaks.
4. Compare Hotel and Neighborhood Demand
Build a Fair Benchmark
After reviewing venue-level signals, compare your hotel’s performance with the surrounding market. This helps you predict whether future bookings will grow or stall - and separate property-specific problems from market-wide demand shifts.
Compare like with like. Choose hotels with similar room counts, classes, amenities, guest mixes, room types, and price positions. Define the area using a fixed neighborhood radius, convention district, or ZIP-code set. Keep that boundary unchanged across reports, and use the same reporting period, inventory rules, and cancellation treatment for both datasets.
Track occupancy, ADR, RevPAR, pace, cancellations, and length of stay together. Check pace weekly, separating weekday business demand from weekend leisure demand. Otherwise, a change in guest mix could mask weakness. This split helps show whether demand is slowing at your hotel or throughout the area.
Match the Signal to the Action
Signal | Meaning | Action |
|---|---|---|
Hotel occupancy, pace, and RevPAR fall while comparable hotels stay stable | Property-specific weakness in pricing, visibility, conversion, or distribution | Test rates, update ads, and improve direct-booking offers to restore pace. (See our guide to boosting direct bookings for specific tactics.) |
Hotel and comp-set occupancy fall with similar pace | Market-wide demand weakness | Target flexible dates, drive markets, and less-affected segments to support pickup. |
Neighborhood traffic rises without hotel bookings | Traffic may be local, daytime, or tied to other hotels | Test overnight packages and proximity messaging to increase direct hotel reservations. |
Hotel occupancy rises but ADR and RevPAR trail the market | The hotel may be discounting too deeply | Test value-added offers and adjust room-type and stay-length pricing. |
Use this benchmark to distinguish market shifts from local changes in access, development, or guest mix.
Check What Is Changing Nearby
Neighborhood traffic is not hotel demand. Pair aggregated visitation with a privacy-safe overnight-share metric. Then check it against booking or lodging data before changing forecasts.
Keep a local demand calendar that covers development openings, construction, access changes, and major events. Compare booking pace before and after each change, controlling for weekday, season, weather, room inventory, and events in competing districts.
A new rail station may improve access but redirect activity to another neighborhood; development may suppress bookings through construction noise and road restrictions before generating demand after completion.
Track length of stay and segment mix to spot shifts between weekday business and weekend leisure demand. Review those shifts monthly. Investigate when pace lags the comp set, the RevPAR index slips below market, or neighborhood visits rise without matching room demand.
Use those gaps to guide the geo-specific campaigns you test next.
5. Test Geo Forecasts With Targeted Campaigns
Use campaign tests to find out which geo signals turn into bookings.
Set Up the Forecast Test
Bring together origin-market searches, bookings, lead times, access data, local events, and room availability. Before launch, record each market’s expected room nights, revenue, and booking window.
Where possible, leave a comparable market out of the campaign as a holdout. This helps separate advertising impact from seasonal demand. Then measure campaign lift by market against your forecasts.
Match Campaigns to Market Intent
Prioritize markets based on search volume, booking intent, lead time, access, projected room-night value, and acquisition cost.
For drive markets, use paid social with parking or flexible-cancellation offers. For air travelers, launch metasearch campaigns and airport/transit landing pages earlier. Time each campaign to the market’s booking window.
If searches increase but bookings don’t, check availability, pricing, landing-page relevance, and booking friction before spending more.
Measure Results and Adjust
Each week, review bookings, room nights, revenue, ROAS, cost per booking, and direct-booking share by market. Reconcile those results once the stay dates have passed.
Separate completed stays from cancellations and no-shows so you don’t overstate value. Increase budgets where completed stays are profitable. Cut back on weak campaigns and test different content or offers. Let demand patterns - not clicks - guide pricing, stay controls, and channel mix.
Use Campaign Support Without Outsourcing Validation
Execution tools can help run campaigns, but forecasts still need to match actual bookings. Sail’s AI-managed Facebook, Instagram, and metasearch campaigns can support execution, but they don’t replace forecast validation.
Keep comparing predicted demand, value, and timing with actual bookings, including bookings that come in organically.
Conclusion: Check Forecasts Against Actual Bookings
Treat these five signals as one forecast - and check it against actual bookings. For each feeder market, track bookings, lead time, stay dates, room nights, revenue, and channel.
Start with three to five feeder markets that have enough booking volume or a demonstrated lift in bookings. Add more only when they improve forecast accuracy, direct bookings, or revenue compared with the baseline.
Validation check for all five methods: Keep boundaries fixed. Compare 30-, 60-, and 90-day forecasts with last year’s results and historical booking curves. Track sample size, recency, reporting delay, modeled versus observed data, missing records, duplicates, and small-group suppression.
Once the data is clean, test whether the signal shows cause and effect or just correlation. Visits and bookings may both increase because of the same event; one doesn’t necessarily cause the other. Use holdouts or controlled tests to estimate lift. Without those tests, label the result tentative.
Use those results to refine the next forecast. Compare predicted and actual room nights, revenue, occupancy, and lead time by market and stay date. Judge each forecast using ONLY the information available when it was made. Before adding complexity, revise the assumptions behind repeated misses.
FAQs
How can I forecast demand with limited booking history?
Use external market signals and real-time data to fill gaps in your booking history. Track local events, school breaks, public holidays, weather patterns, and competing hotels’ rates and room packages to anticipate spikes in demand. Pair these signals with data from your Property Management System (PMS) to guide your decisions.
Sail’s AI-powered marketing solutions help increase direct bookings and visibility, supporting performance even when historical data is limited.
How do I measure whether geo data improves forecast accuracy?
Regularly compare actual occupancy rates with AI predictions. Track gaps over time to spot areas that need work and check whether forecast accuracy is improving.
Update your AI models with new data and review their performance regularly. Monitor occupancy rates, average daily rate (ADR), and revenue per available room (RevPAR) to fine-tune forecasts as local trends change.
What should I do when geographic signals conflict?
When geographic signals conflict, use AI-driven forecasting to bring together past booking trends, real-time market conditions, and factors such as local events or weather. AI can spot connections among these factors, helping resolve mixed signals and produce accurate, up-to-date predictions.
Pair these insights with your expertise to respond to your market’s specific conditions. Keep your data clean and consistent so your forecasts stay reliable.
Related Blog Posts
Share:
20 years of hospitality lessons. No fluff. No spam
Join 500+ hospitality pros getting our best growth playbooks.

hi@sailtech.ai
36 East 31st Street, New York, NY 10016
© 2026 Sail. All rights reserved.